
A protocol for monitoring with Thermal Cameras
In the area of monitoring, we suspect that Cacophony’s thermal cameras have the potential to deliver three keys benefits:
A substantial reduction in the effort required to monitor a reserve
A substantial increase in the amount of data produced from monitoring efforts
A substantial increase in the quality of data produced from monitoring efforts
But those are just assumptions, and they need challenging. So a field experiment was born. And today we share some of the results.

A brief introduction – I’m Matthew Hellicar and I have been working closely with Grant and the team at The Cacophony Project for just over a year now. I’m a trapper – I volunteer with the Summit Road Society at the Omahu and Ohinetahi reserves and also volunteer with Predator Free Sumner Bays at Jollies Bush, Upper Mahoe-nui, and Lower Mahoe-nui reserves. In the last year, I’ve been running a field programme with The Cacophony Project – taking the kit the clever engineers have built and seeing if I can make it deliver its promises out in the bush. In collaboration with Living Springs (in the Port Hills south of Christchurch) we formed a dedicated test site in a 50-hectare area of regenerating bush.
It wasn’t hard to decide on priorities for those tests; Monitoring & Control. If you’re a regular reader of this blog, you’ll have seen the beginnings of our Control tests in the Blind-Snap blog entry. Today I’m going to share some of that work on Monitoring.
The Joy of Monitoring
“You can’t manage what you can’t measure.” Abbie Reynolds, CEO, Predator Free 2050
If you’ve ever been involved in installing and maintaining a trapping network, you’ve probably already spent hours (perhaps a few, perhaps dozens, perhaps hundreds) trying to measure the abundance of predators.
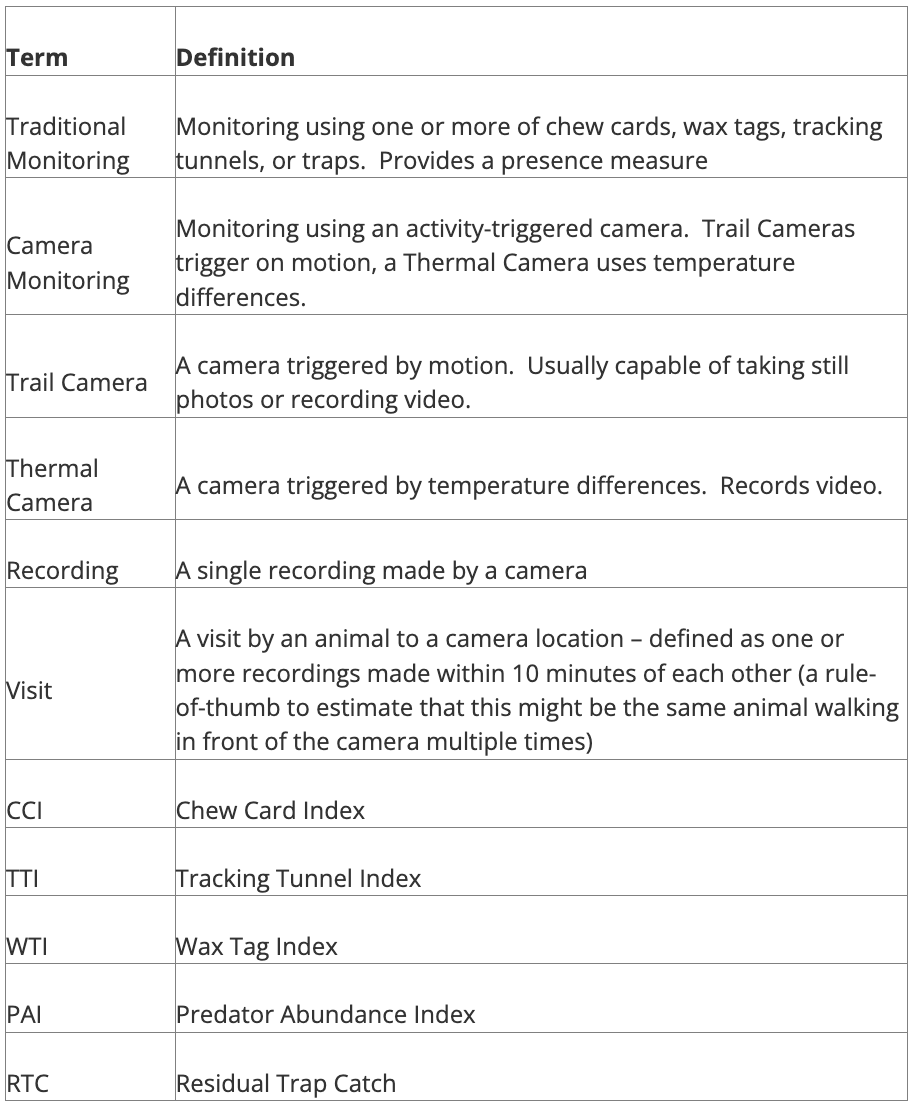
You may have experienced the questionable joy of spending a substantial amount of effort deploying and retrieving cards and tags and getting back that one piece of crucial data – the Predator Abundance Index (PAI). Or maybe you’re using CCI (Chew Card Index) or TTI (Tracking Tunnel Index). Or maybe you’re letting your traps do it for you and calculating an RTC from your catches.
If so, you’ll already know that the pay-off for all those hours of hard graft is a small amount of data. In the real world, that tends to lead to such efforts being applied once a quarter, giving a seasonal baseline (once you’ve gone through that loop for a whole year). It’s sometimes not until the second year that you can get to see any impact from your trapping efforts. If you're keen, you may also have spent hours mapping the locations of the cards in order to try to identify species hotspots and using that to inform changes to the trapping networks.
All of the above is crucial work but I refuse to believe that it’s the most efficient way to gather that data.
Some Definitions
The Scope of the field test
Name: Section A (there are two other sections of bush at this site, named B & C, separated from Section A by grazing ground)
Area: 50 hectares.
Terrain: Mixed regenerating bush surrounding a large central water gully with a secondary smaller gully. Land rises to a rocky ridge. Stock fence along top of reserve and down each side. A minor road separates the lower part of the gully
Period: Data collected during Winter season – June, July, August 2020.
Deployments
For traditional monitoring, I followed the existing DOC protocols which led to two tracking tunnel lines (shown in orange below) and four chew card lines (shown in yellow below).

Chew cards were deployed for 7-night durations. Ink cards were deployed overnight.
Deploying Thermal Cameras
A standardised protocol for deploying monitoring cameras doesn’t yet exist. The best data would be gathered if we could saturate the environment with cameras, covering the entire reserve with cameras at a defined spacing (the same would apply for chew cards). Unless you’re funded by some benevolent billionaire, that’s not realistic. So I developed a Sweep Protocol that allows an area to be monitored using a small number of cameras, moving between locations.
Wooden poles were placed 200 metres from each other, allowing me to identify 12 locations (monitoring stations). If you want the maths, that mean each station was responsible for measuring activity over 4 hectares.
I borrowed 3 thermal cameras from Cacophony and deployed cameras as shown below in four sets. Each deployment was for 7 nights, allowing the cameras to collect data across the whole reserve once every four weeks.

Collecting and Understanding the Data
The table below shows a summary of the data collected.
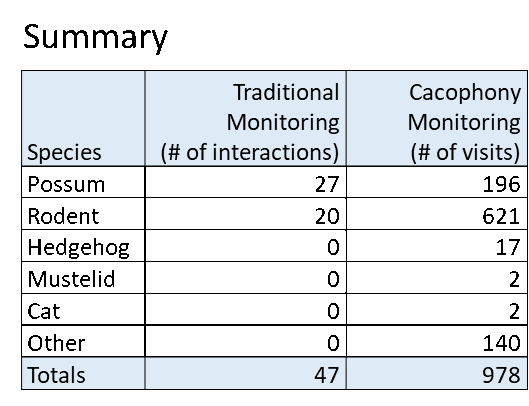
Note: “Other” includes recordings of a dog, some sheep, a few birds, and some insects.
Those 978 visits are actually derived from more than 4,000 individual recordings made by the cameras. If we were using trail cameras, some poor soul (me) would have to sit and watch every recording, attempt to identify the animal in the recording, and attempt to make a record of everything seen.
Note: The Cacophony cameras are already known to be substantially more sensitive than trail cams, so we're likely to be seeing up to 50 times more than what a trail camera might see.
Assuming an average of a 30 second recording, if we generously assume I could watch that recording, identify, classify, and record the data within a minute, that might be 4,000 minutes. That could be 66 hours of work! And after all that work, there's the big question of what the trail camera might not have seen - "the missing bullets".

Luckily, I’m using the Cacophony Thermal Cameras. They automatically upload recordings to Cacophony’s cloud servers where they are processed by some rather clever software. The software “watches” each recording and creates a “track“ for every animal in the recording. It also runs each recording through Cacophony’s AI model which classifies the animals in the recording, tagging them by species. By the time I log on to the server, I have a list of recordings that are already tagged by the AI. I can scan down the list and see at a glance what might be interesting. If I want to, I can watch any of the recordings myself and add tags or other data. But there’s a lot of recordings and I really don’t want to spend time going through them all to work out what the cameras have seen.
This is where Visits come to my aid. Instead of browsing through the individual recordings, I can go to the “Visits” view and the software will collate all the recordings into a visits summary.

So now I have a simple table that tells me how many visits each species of predator made to my monitoring locations over the period. That could be really quite useful. Using these cameras, I've gained 978 useful data points as opposed to the 47 I gained using traditional monitoring methods.
What does all this mean?
Intervening in an ecosystem is a risky business for all the creatures that depend on that ecosystem. Changing that ecosystem without measuring the impact of our intervention is foolish at best, criminal at worst. What I’ve shown here can help remove a lot of the drudgery from monitoring that impact while providing much richer information.
Cacophony Monitoring vs Traditional Monitoring
Informed interventions are necessary if we are to achieve our goals. If we don’t understand the impact of our efforts, it’s impossible to be certain whether we’re actually helping. And that’s a sobering thought for those of us who are dedicating our lives to trying to help our wildlife flourish.
More to come on this but I'd welcome your comments on any of the items discussed here.
As always, we welcome your feedback so don't hesitate to get in touch - leave a comment below or email us at blog@cacophony.org.nz.
References and Useful Links
You can download a pack describing the development of the methods described here.
Thermal cameras are available here: https://www.2040.co.nz/collections/thermal-camera-for-predators